BMI Calculator
BMI Calculator
Body Mass Index Calculator
BMI = 23.0 kg/m²
Corresponds to normal BMI range (18.5 - 25.0 kg/m²) for adults.
What is the BMI Calculator?
The BMI Calculator is a free, browser-based tool for calculating Body Mass Index (BMI), representing an internationally recognized proxy measure of body fat. Originally conceived in the 1830s by Belgian statistician Adolphe Quetelet, BMI has grown into the baseline screening standard used by healthcare professionals worldwide to categorize individuals into weight classifications.
It provides a quick, non-invasive estimate of whether a person is underweight, normal weight, overweight, or obese. While BMI does not directly measure body fat percentage (as it cannot distinguish between muscle mass and fat tissue), it correlates strongly with more direct measures of body fatness and serves as an important diagnostic baseline for prospective health risks.
Adult BMI Classifications
For adults aged 20 and older, BMI values are grouped into standard weight status categories defined by the World Health Organization (WHO) and the Centers for Disease Control and Prevention (CDC). These ranges remain identical for both men and women of all body types.
| Classification | BMI Range (kg/m²) | BMI Prime |
|---|---|---|
| Severe Thinness | < 16.0 | < 0.64 |
| Moderate Thinness | 16.0 – 16.9 | 0.64 – 0.67 |
| Mild Thinness | 17.0 – 18.4 | 0.68 – 0.73 |
| Normal (Healthy Weight) | 18.5 – 24.9 | 0.74 – 0.99 |
| Overweight | 25.0 – 29.9 | 1.00 – 1.19 |
| Obese Class I (Moderate) | 30.0 – 34.9 | 1.20 – 1.39 |
| Obese Class II (Severe) | 35.0 – 39.9 | 1.40 – 1.59 |
| Obese Class III (Morbid) | ≥ 40.0 | ≥ 1.60 |
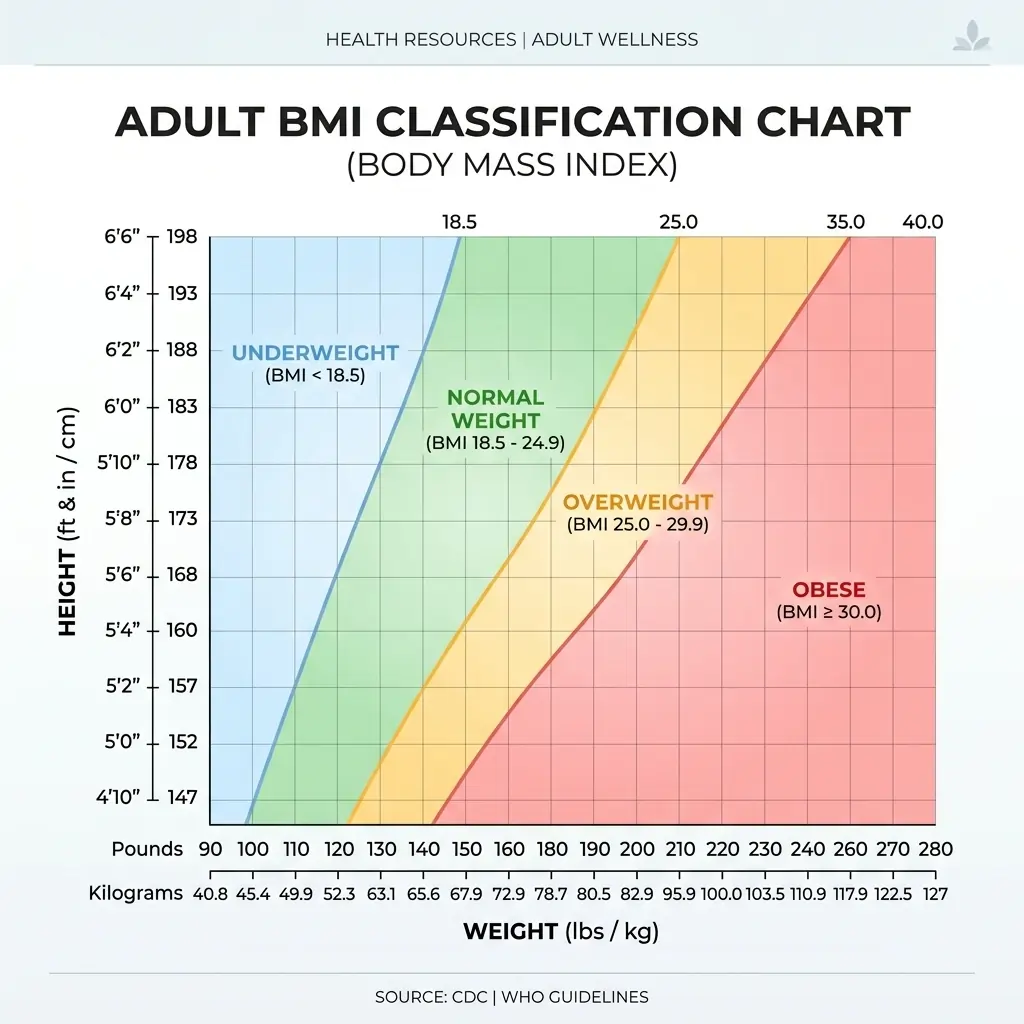
Figure 1: Visual grid chart illustrating BMI classification bounds based on height and weight.
BMI Percentiles for Children & Teens (Ages 2-19)
BMI is calculated the same way for children and teens as it is for adults, but the resulting number is interpreted differently. Because children grow rapidly and develop body fat at varying rates depending on their exact age and biological sex, their weight status is determined by comparing their raw BMI against growth percentile curves of a reference population (developed by the CDC).
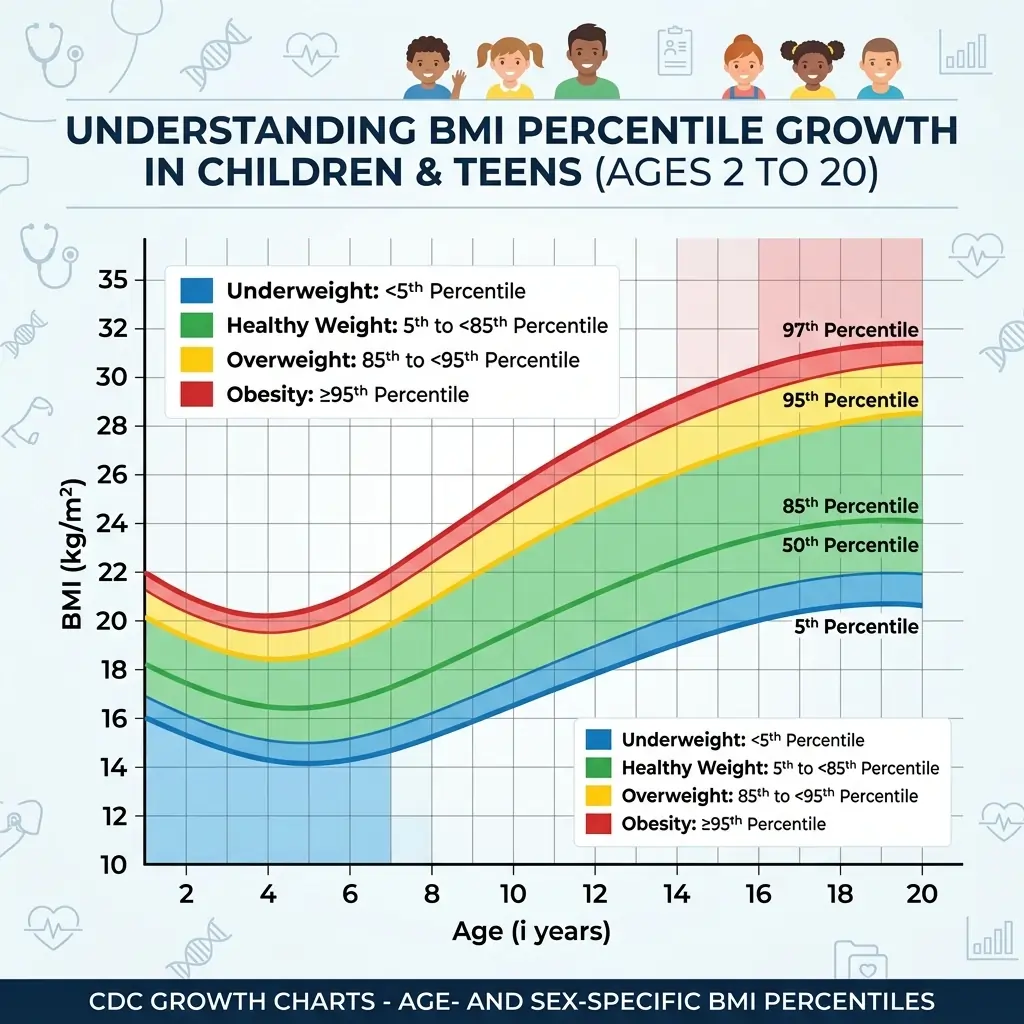
Figure 2: CDC BMI-for-age growth percentile curves for boys and girls.
| Category | Percentile Range |
|---|---|
| Underweight | < 5th percentile |
| Healthy Weight | 5th percentile to < 85th percentile |
| Overweight | 85th percentile to < 95th percentile |
| Obese | ≥ 95th percentile |
Children's percentiles act as a comparative metric. For example, if a 10-year-old boy has a BMI in the 75th percentile, it means that his BMI is higher than 75% of other 10-year-old boys in the standard reference growth index.
The standard global formula. Height is converted to meters and squared, then weight in kilograms is divided by that value.
75 / (1.78 * 1.78) = 75 / 3.1684 = 23.67 kg/m²
Calculates index using pounds and inches, incorporating a standard mathematical conversion scaling coefficient of 703.
[160 / 70²] * 703 = [160 / 4900] * 703 = 22.95 kg/m²
Risks of High BMI (Overweight/Obese)
Maintaining a body weight significantly above normal distributions is associated with elevated risks for chronic conditions:
- Cardiovascular Diseases: Hypertension, stroke, and coronary heart blockages.
- Type 2 Diabetes: Elevated fat levels increase insulin resistance.
- Respiratory Issues: Sleep apnea, chronic snoring, and hypoventilation.
- Mechanical Loading: Osteoarthritis and accelerated joint wear.
Risks of Low BMI (Underweight)
An excessively low BMI denotes nutritional deficits or underlying metabolic concerns, carrying distinct clinical risks:
- Nutritional Deficits: Anemia, chronic fatigue, and electrolyte imbalances.
- Osteoporosis: Reduced bone mineral density, elevating fracture risk.
- Immune Impairment: Higher vulnerability to infections and slow healing.
- Hormonal Disruptions: Menstrual irregularity and infertility.
When BMI Fails to Be Accurate
While BMI is an excellent comparative epidemiological index, it should not be considered an absolute measure of personal body fat or diagnostic health. Because it only accounts for gross weight and height, it does not distinguish between muscle mass and fat tissue.
Muscle is much denser than fat. Athletes and bodybuilders can have high BMIs that classify them as "overweight" or "obese" despite having minimal body fat.
Older adults often lose muscle mass and bone density (sarcopenia) and carry higher visceral fat, which BMI fails to reflect.
BMI does not indicate where fat is stored. Abdominal visceral fat carries significantly higher metabolic risks than subcutaneous fat in other areas.
Frequently Asked Questions
Is BMI accurate for athletes?
+
No. BMI does not distinguish between muscle weight and fat weight. Because muscle is denser than fat, muscular athletes often get a high BMI score that incorrectly classifies them as overweight or obese, despite having excellent health and low body fat.
What is a healthy BMI range for adults?
+
For adults aged 20 and older, a normal or healthy BMI range is between 18.5 and 24.9 kg/m². Scores below 18.5 are classified as underweight, scores from 25.0 to 29.9 are overweight, and scores of 30.0 or higher are categorized as obese.
How is children's BMI calculated differently?
+
While the raw BMI calculation formula (weight / height²) is identical for children and adults, it is interpreted using age-and-sex-specific growth percentiles for anyone under 20. This is because body composition changes rapidly as children grow, and fat distributions differ significantly between boys and girls during developmental years.
What is BMI Prime?
+
BMI Prime is a simple ratio of your actual BMI to the upper limit of the normal weight BMI range (which is 25.0). It is calculated as actual BMI / 25. A BMI Prime between 0.74 and 1.00 represents a normal weight. A value greater than 1.00 is overweight, and a value below 0.74 is underweight.